
In the fast-paced world of manufacturing, every second counts. Reducing manufacturing lead time is a game-changer for operational efficiency, and that’s exactly what this project aimed to achieve. By diving deep into data analysis, I tackled three key questions: What’s the real lead time across the plant? How do regular production processes compare to prototypes? And which clients and work centers offer the biggest opportunities for continuous improvement? Using SQL and Power BI, I turned raw data from the QAD ERP system into actionable insights, analyzing performance at the plant, client, and work center levels. Here’s how I did it.
Business Context: Tackling Manufacturing Efficiency
The Challenge of Measuring Real Lead Time
In manufacturing, lead time—the duration from opening a work order to closing it—can make or break efficiency. Long lead times often hide inefficiencies like bottlenecks or resource mismanagement. The goal was to measure the real manufacturing lead time across the plant to uncover where time was being lost. In my experience, working with real-time transactional data from QAD opened my eyes to patterns that static reports often miss, like unexpected delays in specific operations.
Why Data-Driven Insights Matter in Manufacturing
Data-driven decision making is the backbone of modern manufacturing. By leveraging ERP data analysis with QAD, companies can move beyond gut feelings to pinpoint exactly where processes slow down. This project aligned with Industry 4.0 principles, using data to drive lean manufacturing and optimize production cycle time. The multi-level approach (plant, client, work center) ensured insights were actionable at every stage, from high-level strategy to granular process tweaks.
Data Sources: Leveraging QAD for Actionable Insights
Extracting Data from QAD Transactions
The foundation of this project was the QAD ERP system, specifically the transactional data from work orders and operations. These records captured every step of the manufacturing process, from order creation to completion. Using SQL, I queried the QAD database to extract relevant fields, such as timestamps, work order types, and client details. Ensuring clean, accurate data was critical—missing or inconsistent entries could skew the analysis, so I spent time validating the dataset upfront.
SELECT
customer_code as 'Customer',
planner_code as 'Planner',
work_order_id as 'WO ID',
assy as 'Assembly Number',
work_center as 'Work Center',
s_date as 'Start Date',
e_date as 'End Date',
c_date as 'Closed Date'
FROM closed_work_orders
ORDER BY c_date,work_order_id;Ensuring Data Quality and Relevance
Data quality is make-or-break in manufacturing data analysis. I filtered out incomplete records and cross-checked timestamps to ensure accuracy. The QAD ERP system provided a wealth of information, but it required careful handling to focus on manufacturing throughput time. This process taught me the importance of understanding the data’s context—knowing how work orders were logged in QAD helped me avoid misinterpretations that could lead to faulty conclusions.
| Customer | Planner | WO ID | Assembly Number | Work Center | Start Date | End Date | Closed Date |
| HVA | SMT2ENID | 21080112 | Z05819248 | ICT | 2022-12-13 | 2022-12-17 | 2023-01-03 |
| HVA | SMT2ENID | 21080112 | Z05819248 | SMT | 2022-12-12 | 2022-12-14 | 2023-01-03 |
| HVA | SMT2ENID | 21080112 | Z05819248 | FCT | 2022-12-13 | 2022-12-17 | 2023-01-03 |
| HVA | SMT2ENID | 21080112 | Z05819248 | WAVE | 2022-12-13 | 2022-12-17 | 2023-01-03 |
| HVA | SMT2ENIE | 22182602 | 197043-1 | ICT | 2022-11-23 | 2023-01-03 | 2023-01-03 |
| HVA | SMT2ENIE | 22182602 | 197043-1 | SMT | 2022-11-17 | 2023-01-03 | 2023-01-03 |
| HVA | SMT2ENIE | 22182602 | 197043-1 | FCT | 2022-11-23 | 2023-01-03 | 2023-01-03 |
| HVA | SMT2ENID | 23957088 | Z05819250 | ICT | 2022-12-19 | 2022-12-21 | 2023-01-03 |
| HVA | SMT2ENID | 23957088 | Z05819250 | SMT | 2022-12-18 | 2022-12-19 | 2023-01-03 |
| HVA | SMT2ENID | 23957088 | Z05819250 | WAVE | 2022-12-18 | 2022-12-21 | 2023-01-03 |Exploratory Data Analysis (EDA): Uncovering Patterns
Analyzing Lead Time at the Plant Level
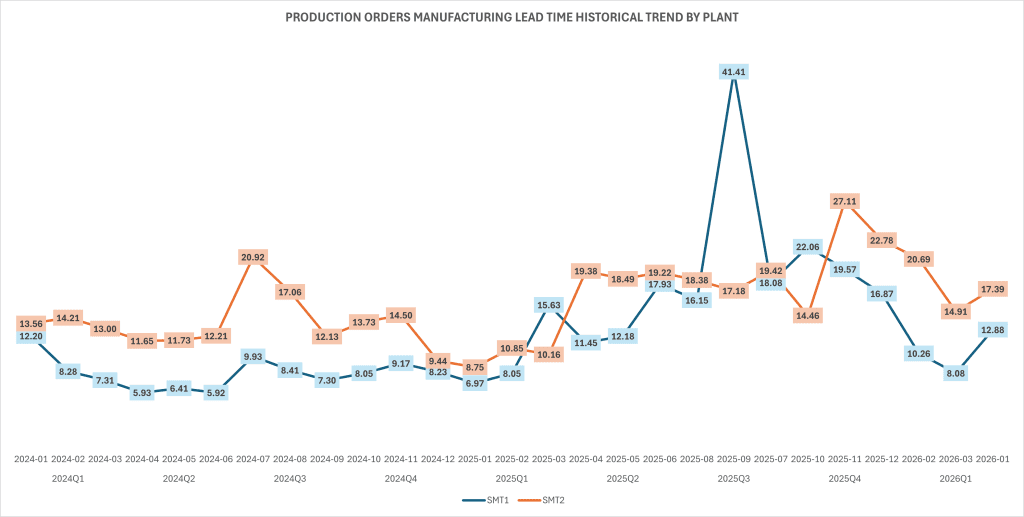
The first level of analysis focused on the big picture: plant-level lead time. Using SQL, I calculated the average days between work order creation and completion across all operations in QAD. Power BI dashboards visualized these trends, making it easy to spot outliers. For instance, I noticed certain months showed spikes in lead time, which, upon digging deeper, tied back to seasonal demand surges. This macro view set the stage for more granular insights.
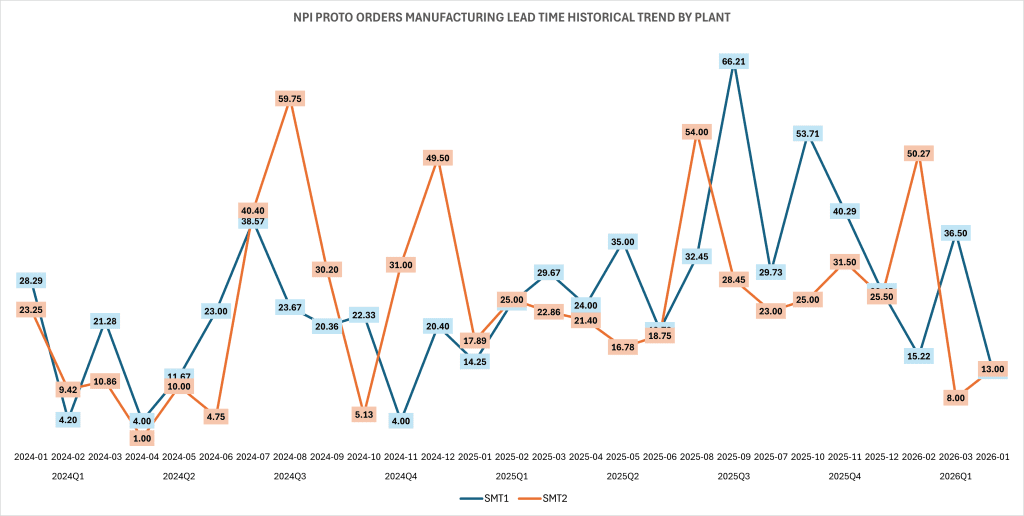
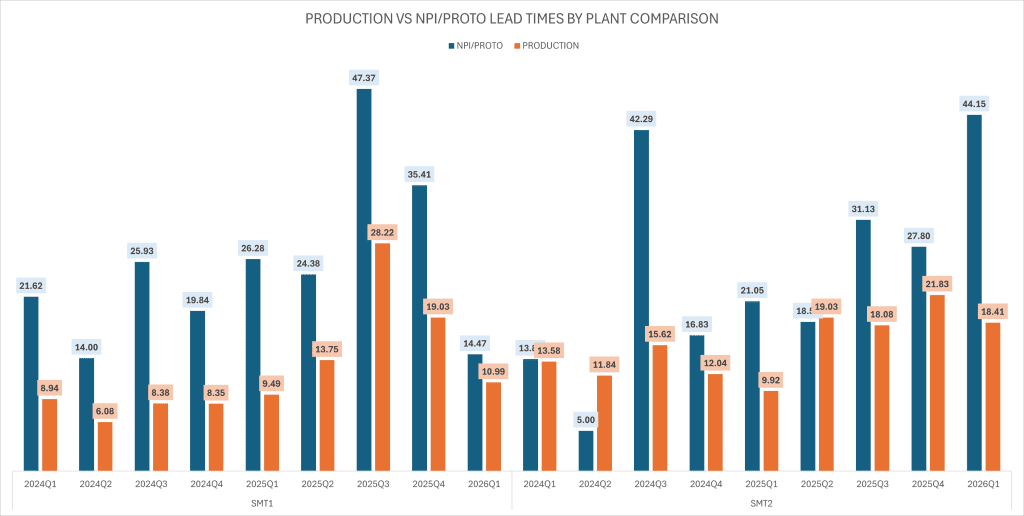
Comparing Regular Production vs. Prototypes (NPI)
Next, I compared lead times for regular production versus new product introductions (NPIs) or prototypes. By segmenting work orders in SQL (production vs. NPI-PROTO) within QAD, I uncovered significant differences. Prototypes often took longer due to manual adjustments in specific work centers. I recall a case where one prototype’s lead time doubled because of a single work center’s setup process—a discovery that sparked immediate process tweaks. Power BI’s interactive visuals made these comparisons clear, helping stakeholders see the impact of NPIs on overall efficiency.
Analysis and Modeling: From Data to Decisions
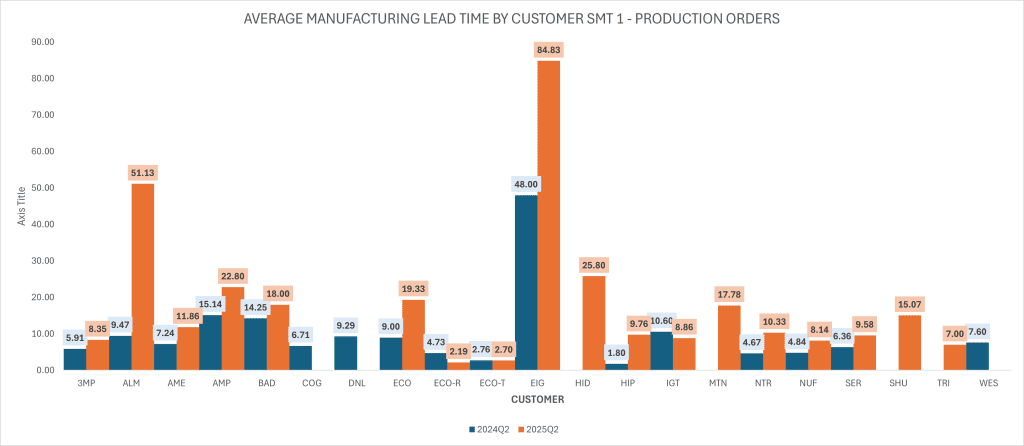
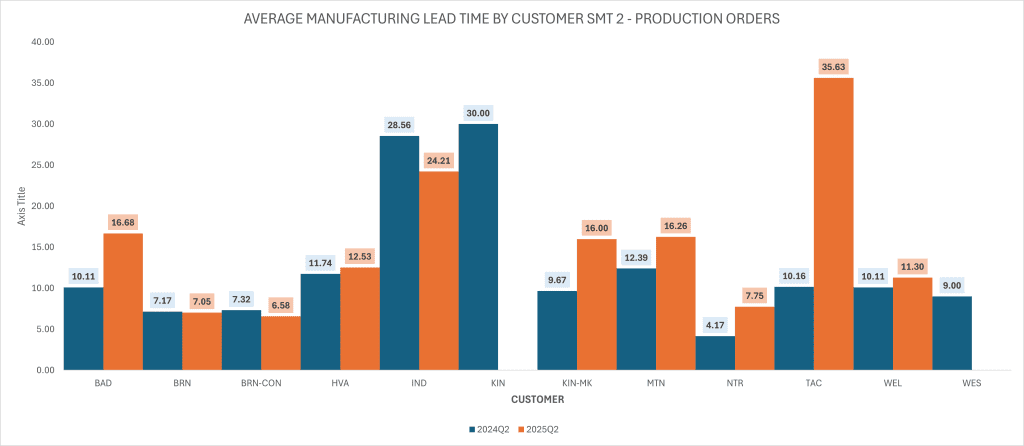
Identifying High-Impact Clients
Drilling down to the client level, I used SQL to group lead time data by client in QAD, revealing which ones had the longest manufacturing cycles. Power BI dashboards highlighted clients with above-average lead times, allowing the team to prioritize improvement efforts. One client stood out due to complex requirements that bogged down production. Sharing these insights with the operations team led to targeted discussions with that client, improving collaboration and reducing delays.
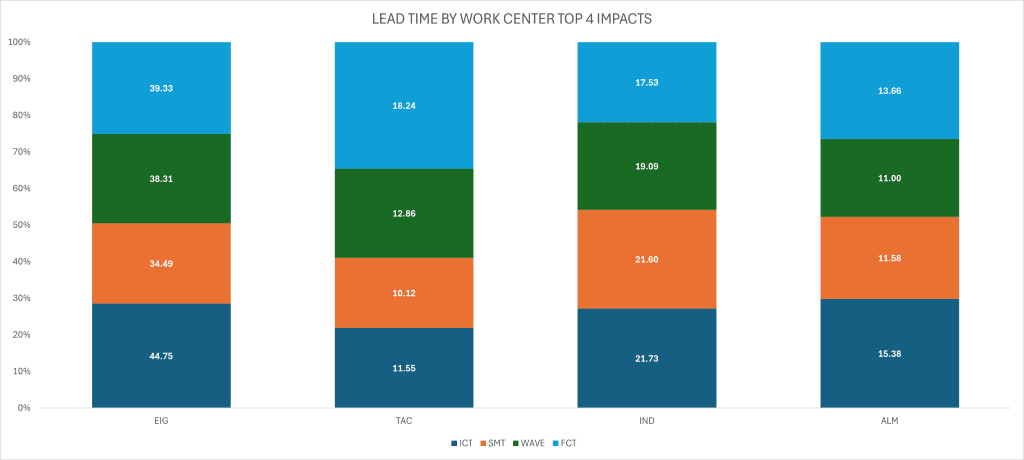
Pinpointing Bottlenecks in Work Centers
At the work center level, the analysis got granular. By mapping lead times to specific work centers in QAD, I identified bottlenecks causing delays. For example, one work center consistently showed longer processing times due to equipment limitations. This finding was a lightbulb moment—reallocating resources to that work center cut lead times significantly. Data visualization in Power BI made it easy to communicate these findings, turning raw numbers into compelling visuals for decision-makers.
Conclusions and Recommendations: Driving Continuous Improvement
Key Findings and Their Impact
The analysis revealed three critical insights: plant-level lead times varied seasonally, prototypes significantly extended lead times, and specific clients and work centers were key bottlenecks. These findings drove continuous improvement initiatives, like streamlining prototype processes and optimizing work center schedules. The project showed how data-driven process improvement can transform operations, aligning with Six Sigma and Kaizen principles.
Actionable Steps for Lead Time Optimization
Based on the analysis, I recommended:
- Implementing automated setup processes for NPIs to reduce manual adjustments.
- Prioritizing resource allocation for high-impact work centers.
- Collaborating with high-lead-time clients to simplify requirements. These steps led to measurable improvements, like a noticeable reduction in lead time for a key client after process adjustments.
Technologies and Tools: Powering the Analysis
SQL for Data Extraction and Processing
SQL was the workhorse for data extraction. I wrote complex queries to join work order and operation tables in QAD, calculate time differences, and segment data by type and client. Structured Query Language’s flexibility allowed me to handle large datasets efficiently, ensuring the analysis was both accurate and scalable.
Power BI for Interactive Visualizations
Power BI brought the data to life. I built dashboards with slicers for plant, client, and work center views, enabling stakeholders to explore trends interactively. The ability to drill down from plant-level metrics to specific work centers made the insights accessible and actionable, reinforcing the value of business intelligence tools in manufacturing.
FAQs: Common Questions About Manufacturing Data Analysis
How Can Lead Time Analysis Improve Operations?
Lead time analysis identifies inefficiencies, enabling targeted improvements that reduce costs and boost delivery times. It’s a cornerstone of lean manufacturing and operational excellence.
What Role Does QAD Play in Data-Driven Manufacturing?
The QAD ERP system provides a centralized source of truth for manufacturing data. With proper ERP data analysis, companies can unlock insights that drive smarter decisions.